Call Analytics
Understand your call patterns, track performance, and see how your AI agent is doing with Akol’s analytics dashboard.
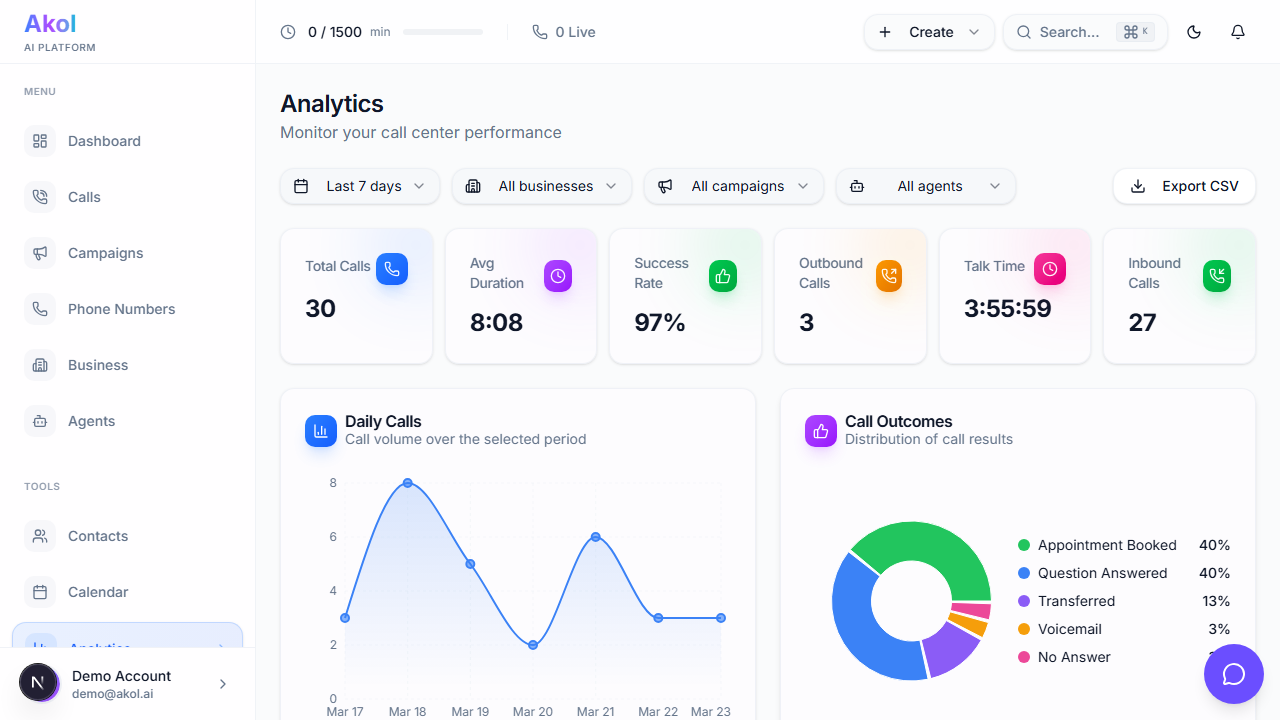
Accessing Analytics
Go to Dashboard > Analytics to see your call data.
Time Range
Filter your analytics by time period:
- Last 24 hours — Today’s activity
- Last 7 days — This week (default)
- Last 30 days — This month
- Last 90 days — This quarter
You can also filter by specific business, agent, or campaign.
Key Stats
At the top of the page, you’ll see these numbers:
| Stat | What It Shows |
|---|---|
| Total Calls | How many calls were handled |
| Inbound Calls | Calls from customers |
| Appointments Booked | Calls that resulted in a booking |
| Talk Time | Total time spent on calls |
| Success Rate | Percentage of calls with positive outcomes |
| Positive Sentiment | Percentage of happy callers |
Charts and Graphs
Daily Call Volume
A chart showing how many calls you get each day. Use this to:
- See your busiest days
- Spot trends over time
- Plan staffing around peak times
Hourly Distribution
A chart showing when calls come in throughout the day. Use this to:
- See your busiest hours
- Decide if you need after-hours coverage
- Adjust your business hours if needed
Call Outcomes
A breakdown of how calls end:
- Appointment booked
- Question answered
- Message taken
- Transferred
- Missed
Agent Performance
If you have multiple agents, see how each one performs:
- Number of calls handled
- Average call duration
- Success rate
Exporting Analytics
Click the Export button to download your analytics as a spreadsheet. Great for:
- Creating reports
- Sharing with your team or business partner
- Tracking performance over time
What Good Numbers Look Like
Here are general benchmarks across industries. Your numbers will vary based on your business type and call volume.
| Metric | Good | Great |
|---|---|---|
| Answered rate | 90%+ | 98%+ |
| Appointment/booking rate | 20-30% | 40%+ |
| Positive sentiment | 70%+ | 85%+ |
| Average call duration | 2-5 min | 3-4 min |
Don’t worry if your numbers aren’t great at first. They improve as you refine your agent’s instructions, add more FAQs, and build out your business profile.
Using Analytics to Improve
- High missed call rate? — Check that your phone number is properly assigned to an agent
- Low appointment rate? — Make sure your agent knows your services and can check your calendar
- Negative sentiment? — Review transcripts of negative calls to find what went wrong
- Long call durations? — Your agent might be giving too much information; keep instructions concise
- Calls at odd hours? — Consider extending your after-hours messaging
Tips
- Check analytics weekly — Spot trends early
- Compare week over week — See if changes to your agent are making a difference
- Focus on your key conversion metric — For most businesses, this is the appointment or booking rate
- Export monthly reports — Track your progress over time